Data virtualization is the process of creating dashboards that are interactive. This allows for people to easily explore data without having to go through complex queries or complicated visualizations. The main advantage of the dashboard is that it provides an overview of the data sources to make it easier to explore data.
The goal of this article is to provide information on the basics of data virtualization, its advantages, and pitfalls to avoid when working with this method. It will also provide some best practices for creating dashboards for exploratory analysis that use data virtualization techniques.
What is Data Virtualization?
Data virtualization is a method used to create data dashboards. These dashboards are interactive, which means that people can explore the data without having to go through complex queries or difficult visualizations. The main advantage of the dashboard is that it provides an overview of the data sources so that people can easily explore them.
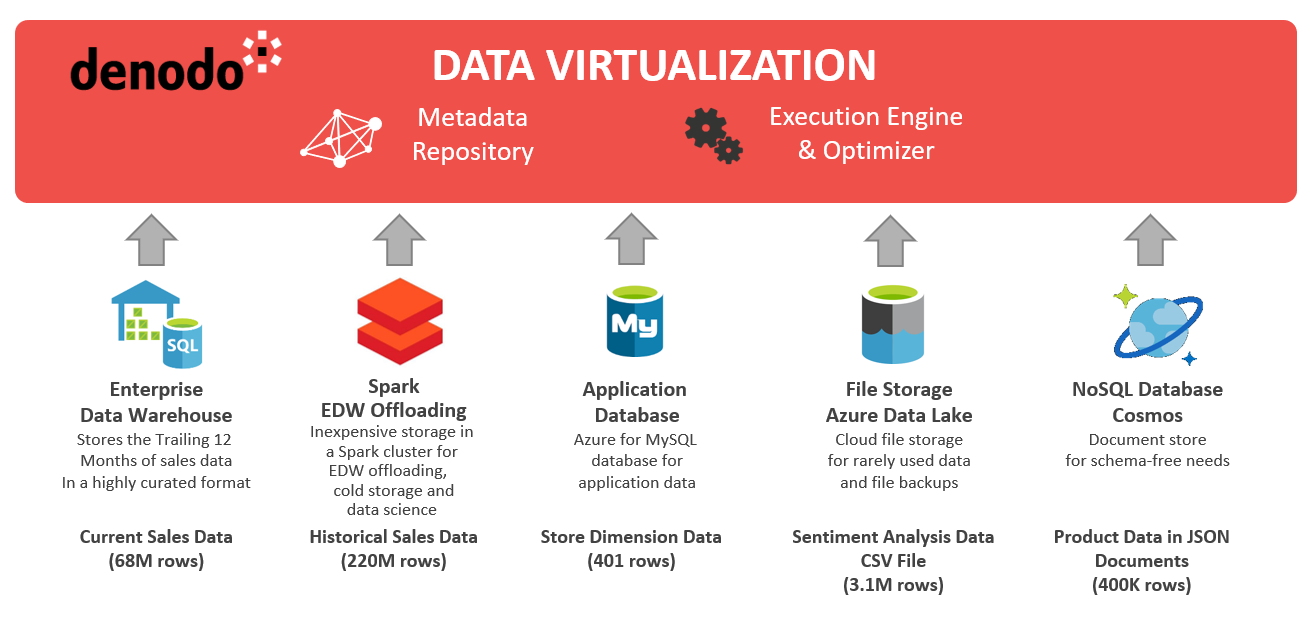
The data is obtained from a data warehouse, where the user querying the database has to access only to a subset of all available data. With virtual tables or views, users can interact with this integrated information rather than having to use different tools to extract and join this information.
The reason to do this is that it’s more practical for business intelligence (BI) users to create interactive data dashboards than writing complex queries or preparing complicated visualizations by themselves. Data virtualization provides an abstraction layer between databases and BI applications so that these applications no longer need direct access to physical databases in order to retrieve the required information.

Advantages of using Data Virtualization
Data virtualization allows people without technical knowledge of SQL query language to explore data. This helps in making the decision-making process easier.
Pitfalls to Avoid when Creating Dashboards for Exploratory Analysis using Data Virtualization
As with any other method, there are some pitfalls that people should avoid when creating dashboards for exploratory analysis using data virtualization techniques. These are discussed below:
When generating dashboard reports, it is important to select the right level of detail in order to provide the most relevant information to users. If this is not done correctly, then it would be more difficult for business users to identify patterns in the data and make informed decisions based on these. Business users have to understand what kind of questions they need to be answered from their queries before writing them down. If they don’t, then the data might not be properly filtered and this could lead to confusion.
The data that is used for dashboards should be of high quality. In order to achieve this, it is important to confirm that the data has been cleaned and standardized before being loaded into the virtualization layer. Otherwise, users might end up seeing distorted information when exploring the data.

It is also important to make sure that the right tools are used for data visualization. This would help business users see patterns and trends in the data more clearly. If inappropriate tools are used, then it would be difficult to identify these patterns and trends, which could impact decision-making.
Best Practices for Creating Dashboards for Exploratory using Data Virtualization
There are some best practices that should be followed when creating dashboards for exploratory analysis using data virtualization techniques. These are discussed below:
The first step is to select the right data sources for the dashboard. This includes selecting the right mix of internal and external data sources. The next step is to create a data model that would best represent the business needs. The data model should be designed in such a way that it can easily be used by business users for generating reports and dashboards.
After the data model has been created, it is important to map the fields in the data model to the source tables. This will help in ensuring that the correct information is displayed in the dashboard.
It is also important to standardize the data before loading it into the virtualization layer. This will help in avoiding any misinterpretations when exploring the data.
Also Checkout: Best cloud web hosting solutions 2021
Also Checkout: Razer Basilisk v2 Wired Gaming Mouse
Once the data has been standardized and loaded into the virtualization layer, it is ready to be used for creating dashboards. The final step is to create the dashboard using the appropriate tools.
The use of data virtualization can help business users to gain a better understanding of their data and make better decisions based on this information. However, it is important to follow best practices when creating dashboards for exploratory analysis using this technique. By doing so, business users can maximize the benefits that data virtualization has to offer.
Conclusion
If you’re looking for ways to make your life easier, consider using data virtualization. This technique will allow business users without technical knowledge of SQL query language the ability explore data and make decisions based on what they find in it. However, there are some pitfalls that people should avoid when creating dashboards for exploratory analysis with this method. It is important to follow best practices when doing so; otherwise, misinterpretations can occur which could impact decision-making abilities. If you want help identifying patterns or trends in your own marketing funnel or lead funnel but don’t know how to do so by yourself, let us know today! Our team has years of experience helping companies like yours maximize their ROI through the use of cutting-edge technology combined with our in-depth knowledge of the digital marketing industry.
See Also: Data Virtualization And Its Best Practices when used with Business Intelligence Software
Comments on “What is Data Virtualization?”